The State of Complaints

Using the advanced filters, we dig through complaint data to get a sense of what the state of accountability in international finance looks like – from near and far.
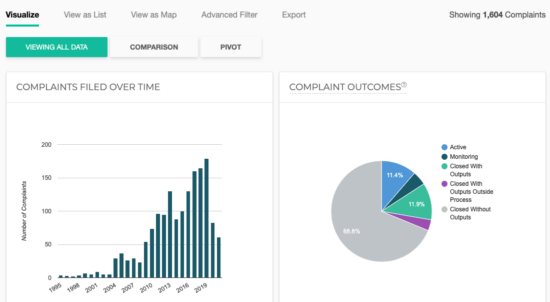
Over 1600 complaints about projects financed by IFIs have been filed to IAMs over the past 27 years. Through filters, charts, and detailed categorical tags, the Accountability Console allows us to see and analyze complaints filed to IAMs in a revolutionary new way. The Console’s features allow us to uncover relationships and trends across the ecosystem that can help inform our understanding and interrogate our assumptions of where accountability in international finance lies, where it has been historically, and where it’s going. This article explores some of the trends we have been observing in the field of accountability, using the filters, charts, and other features from the Console.
Regional Relationships: How do regions compare?
The Visualize feature is a great way to explore complaints through interactive and visual representations of complaint data. The feature allows users to dynamically view and analyze complaint information, such as the frequency of complaints filed over time, the types and rates of outputs achieved from the complaint process, the lengths of stages of the complaint process, the types of issues raised, or the types of project sectors about which complaints are filed. Each of these charts can be viewed using all complaint data, or any number and combination of advanced filters.
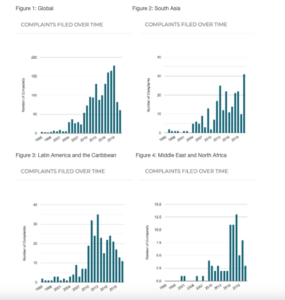
One example our team has been engaging with recently is the frequency of complaints filed over time. Contextualizing trends in complaints filed over time among other factors allows us to test our own assumptions, and align our strategy with ongoing need. In order to best inform our understanding of the accountability system, and where we, as an organization and as a network of broader advocates for accountability, should be focusing our resources we’re asking questions like How does the establishment and existence of regional IAMs impact communities’ access to remedy? and Where do gaps in complaints exist, and might indicate a need for increased outreach and knowledge sharing with civil society networks and community advocates about IAMs? Using the Visualize feature, we can do exactly this by simply comparing what the ‘Complaints Filed Over Time’ chart looks like globally and by each region.

Comparing the above charts allows us to see how the global trend of complaints filed over time compares across particular regions. Notably, we can see that the shape of the global chart, Figure 1, shows a fairly linear growth rate – beginning around 2004, alongside the establishment of new IAMs tied to IFIs, complaints filed have grown relatively evenly over time. Looking at South Asia in Figure 2, we can see that there is also a relatively even linear growth rate over time, though we note that there is slightly more sporadic growth and decline at times. To determine what might be influencing this pattern we can dig further into this subset of complaints in South Asia to explore hypotheses like whether there are particular projects with a high number of complaints. Latin America and the Caribbean, Figure 3, shows slight but steady growth in initial years, with significant growth around 2010 (the same year the Inter-American Development Bank’s accountability mechanism MICI was established in the region) and with two exceptions, a subsequent flattening. The Middle East and North Africa, Figure 4, shows a significantly different picture from the other charts: there is a near total absence of complaints for many initial years, where elsewhere complaints exist – special attention to the y-axis values show the low value increments in the MENA, compared with the other two regional charts. We see stagnated growth for the next few years, indicated by the flattened and slightly lower bars from 2010-2015, followed by more significant growth and subsequent decline. This chart shows that there is much more volatility in the frequency of complaints filed over time in the MENA, compared to other regions and globally. Such volatility may be related to other factors that we can further explore, utilizing additional filters and aspects of the Visualize feature.
Utilizing the Comparison Feature
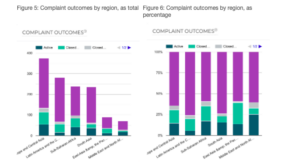
Using the comparison feature, we can view how complaint outcomes compare across regions. The comparison feature is accessible from the Visualize page; click “Comparison” and then click the variable you want to compare. For our regional comparison, we can click “Regions”. The charts produced through the comparison feature can be viewed by total numbers, or with relative values by clicking “As Percentage”.

Seeing these regional complaint outputs comparisons side by side shows us a few noteworthy trends. One of the first things that stands out from the above comparison is the high rate of complaints without outputs from the complaint process across regions. In every region, the proportion of complaints without outputs is at least 60% or more. A look at complaints with outputs from the complaint process shows the fairly wide variance across regions, ranging from 26% in East Asia and the Pacific to just 7% in the Middle East and North Africa, and an average rate of 17% across all regions. With knowledge of the regional variance in complaints with outputs, we can look further into particular stages of the complaint process to understand where bottlenecks are occurring across regions, and whether different regions experience different bottlenecks.

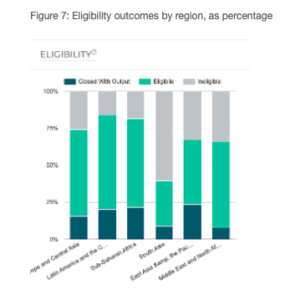
This regional comparison of complaint eligibility shows interesting variation in South Asia, which has the highest rate of ineligible complaints, and the second lowest rate of eligible complaints reaching outputs, just behind the Middle East and North Africa with the lowest. A high rate of ineligible complaints may indicate a need for increased civil society support at early stages of the complaint process, like the pre-filing and filing processes. On the other hand, low rate of eligible complaints reaching outputs may indicate a need for increased civil society support in substantive stages in the complaint process, through dispute resolution and compliance review.
Coupling complaint research of this nature, like the regional complaint analysis above, with knowledge and experiences from local civil society organizations, community groups, and other advocates and stakeholders can be immensely helpful in meeting the need for support, and in understanding the state of accountability in international finance.

